The Effects of Climate Change
Overview
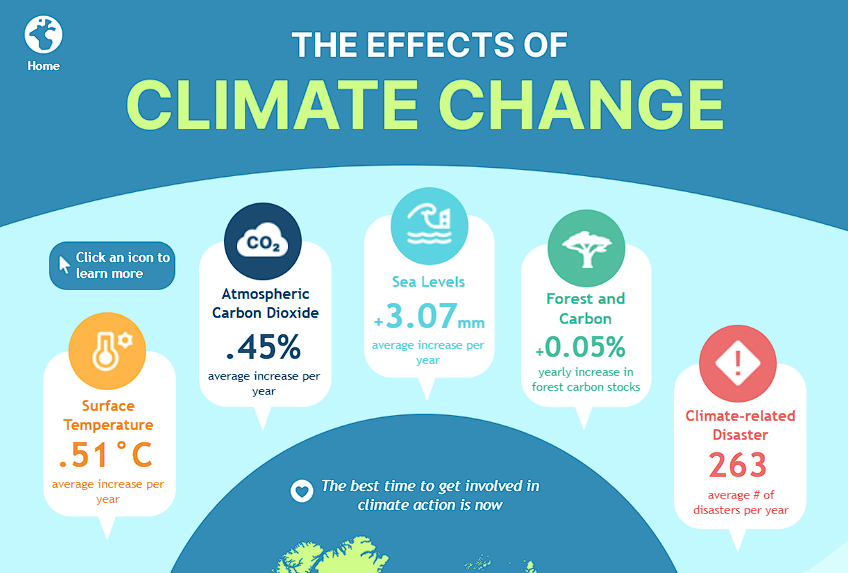
In my Tableau dashboard, “The Effects of Climate Change,” I visualized global surface temperature trends using data from the International Monetary Fund’s Climate Change Indicators Dashboard. This interactive visualization highlights the steady rise in surface temperatures over time and across regions, making the impacts of climate change more tangible and urgent.
The dashboard was awarded 2nd place at the Data Duels competition hosted by The Information Lab, recognizing its clarity, storytelling, and design.